Data Analysis & Heat Mapping
Trend analysis of pest monitoring data is a requirement of most food safety standards. Much useful information is gathered in pest monitoring programmes but all too often little or no use is made of it. We have many years' experience in analysing and interpreting pest monitoring data, and can present it so that it drives the pest management programme; to the benefit of both you, our client, and the pest control contractor.
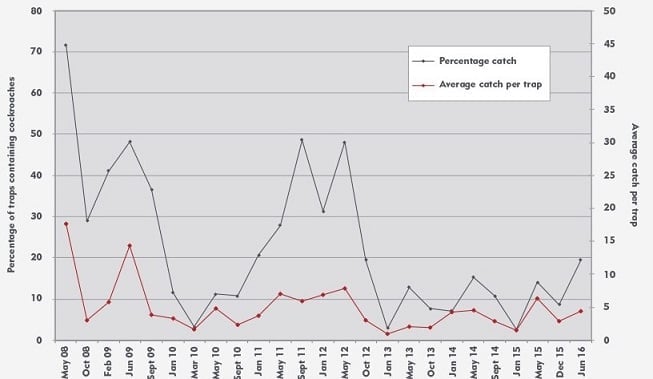
Graphs and contour maps bring data to life. For example, the graph shows cockroach activity at a large food processing facility where we undertake a periodic intensive monitoring programme.
The black plot line shows the proportion of the monitors that have caught cockroaches (a measure of their distribution), whilst the red line shows the numbers caught (a measure of the degree of infestation). What was an extremely heavy infestation in 2008 has been reduced to a much lower level now (eradication is probably impossible at this site). The ‘blip' in late 2011 was caused by poor performance from the incumbent pest control contractor, and resulted in them being replaced.
Would you like to know more about our Pest Management services? Please contact us using this form.