
Kiwa PVEL Updates the PV Module Product Qualification Program (PQP) to Better Address Module Breakage
For 16 years, Kiwa PVEL has served as the solar industry’s leading independent test lab for photovoltaic (PV) modules. As the industry has grown and changed, we’ve regularly updated our suite of extended-reliability tests, the Product Qualification Program (PQP), to address new module technologies, designs, and failure modes, generating the data that matters for solar buyers. The results of this testing are presented in our annual PV Module Reliability Scorecard, a procurement resource accessed by tens of thousands of PV buyers around the world each year.
To address the concerns of the global solar buyer community in 2026, our latest PQP has been released to better assess module breakage, module metastability, UVID, and more. Highlights from the new PQP include:
- A new test to failure approach for mechanical load testing and hail testing, using increased sample sizes.
- Adding post-test stabilization for Ultraviolet Induced Degradation (UVID), Field Exposure (FE), Potential Induced Degradation (PID) and Damp Heat (DH).
- Streamlining UVID testing, pre-test stabilization and Light Induced Degradation (LID) testing.
- Improved reporting for the PQP sample production factory witness and PAN testing.
Below, we highlight some of the main updates and why we’ve refined our testing.

Better Addressing Module Breakage Concerns
Field claims involving high glass breakage failure rates and frame structural failures have been continuously reported over the past years, without a clear trend that module manufacturers have reversed course in their attempt to decrease the material quantity used in their module designs, nor scale down module size.
Kiwa PVEL has introduced two new tests to help module buyers better assess module mechanical strength and durability:
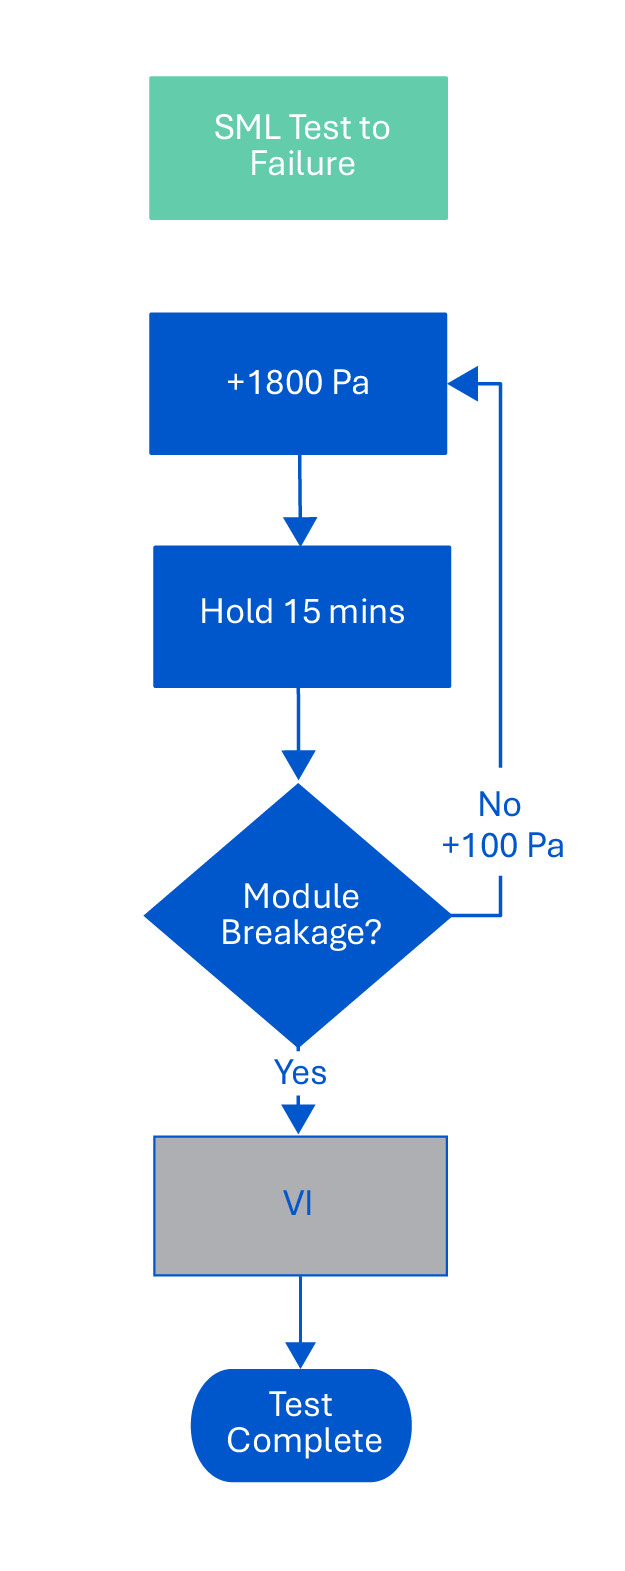
Static Mechanical Load - Test to Failure (SML-TTF)
|
Previous PQP statistics from the Mechanical Stress Sequence (MSS), which will remain a key part of the PQP, could only reveal broad pass/fail rates over time, but could not effectively quantify the mechanical durability of different module designs, nor does MSS distinguish between good and best-in-class manufacturers. The new SML-TTF test sequence focuses on resolving this limitation by quantifying the dominant failure mode and achievable maximum load for each bill of material (BOM) submitted to PQP testing. It also expands the test sample quantity (five additional samples for SML-TTF, on top of the two MSS samples), allowing for better statistical significance Similar to the load testing portion of MSS, during SML-TTF the modules will be tracker-mounted using 400 mm mounting holes (or corner mounting for residential sized modules). The initial test load of 1800 Pa will be applied in the downforce direction, then every 15 minutes another 100 Pa will be applied until module breakage occurs or the test equipment’s maximum pressure is reached. The initial test load of 1800 Pa will be applied in the downforce direction, then every 15 minutes another 100 Pa will be applied until module breakage occurs or the test equipment’s maximum pressure is reached. The 15 minute dwell time for each pressure level is based on our experience testing hundreds of SML modules where we have observed multiple cases of module breakage occurring in the 15 minute window after pressure has stabilized. |
 |
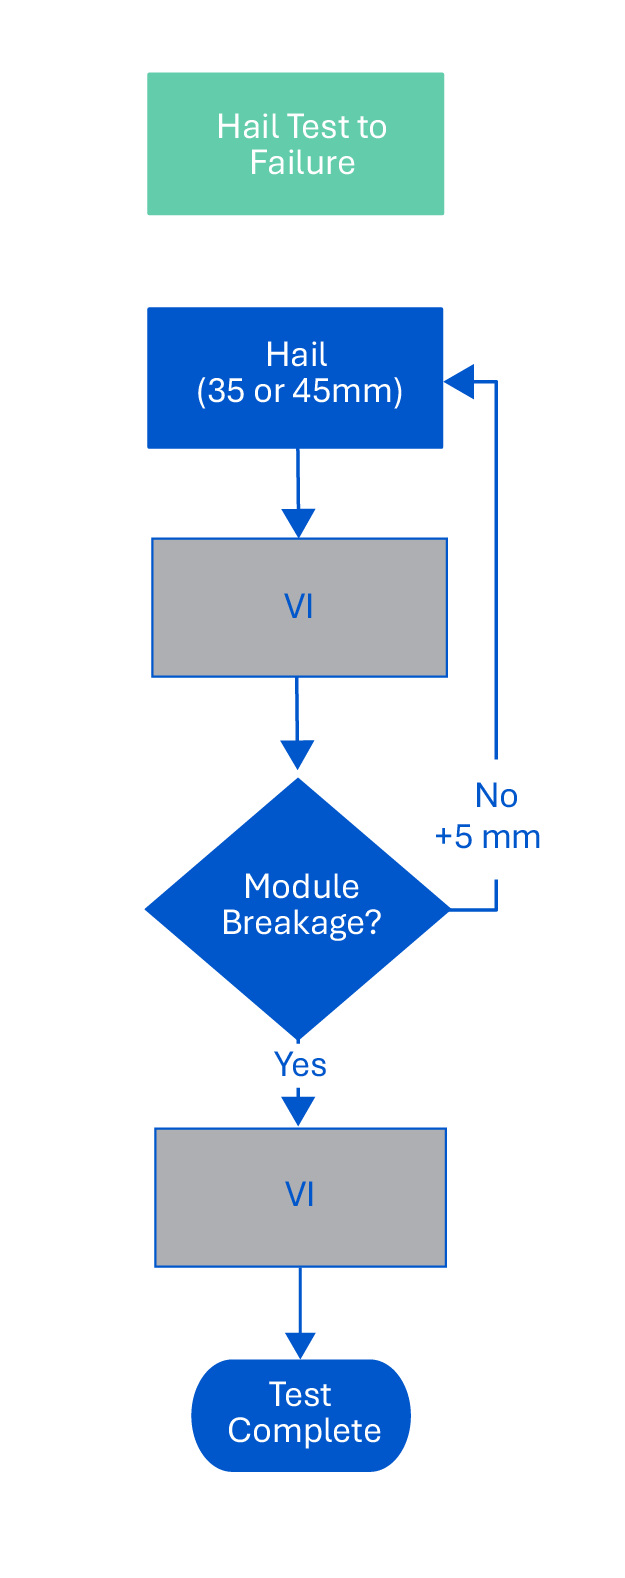
Hail - Test to Failure (Hail-TTF)
|
Due to the brittle nature of glass, accurate assessment of mechanical strength requires large sample sizes and test-to-failure methods. Because of such limitations, the previous Hail Stress Sequence (HSS) test approach following the IEC61215-2:2021 standard (with 11 hail ball impact locations) could only effectively distinguish “atypically bad” from “normal” modules. Due to the low sample size (of two modules per hail diameter) the previous test also had limited repeatability when comparing BOMs or, for example, comparing two glass suppliers of the same specs. Hail testing hundreds of modules in the recent years has allowed Kiwa PVEL to refine our test protocol to focus on the module locations presenting higher failure rates (i.e. the edge, corner and junction box areas). This is coupled with an increased sample size of five modules, and, with a test-to-failure approach using increasingly large hail diameters, enabling better hail test repeatability. We have also modified our PQP sample production witness process to more systematically check critical dimensions on the factory floor for both the frame and glass components.
|
 |
Updated Stabilization Processes
With the prevalence of N-type technologies in the current PV market, labs have been facing increased measurement accuracy challenges related to so-called metastability issues of PV modules. Kiwa PVEL conducted several internal R&D activities to quantify the various metastability mechanisms observed in N-type modules and identified three distinct forms of metastability associated with the PQP reliability test sequences. Those are:
- Slow dark storage degradation which could affect modules following DH testing;
- Accelerated dark storage degradation which is uniquely relevant for modules exposed to UV (post-UVID and post field exposure); and,
- PID-polarization degradation which is uniquely relevant for final characterizations of PV modules exposed to voltage stress (post-PID).
The following final stabilization processes have been added to the PQP to counteract these effects:
|
Test sequence |
Method |
Dose |
Post-stabilization flash |
|
Post-UVID and FE |
Light-soaking (full spectrum) |
≥1 kWh/m² at open circuit |
Within 4 hours |
|
Post-DH |
Light-soaking (full spectrum) |
≥1 kWh/m² at open circuit |
Within 48 hours |
|
Post-PID |
Light-soaking (UV) |
≥0.2 kWh/m² at near MPP |
Within 48 hours |
|
Other |
No stabilization |
N/A |
N/A |
Stabilization will be performed for every BOM with an average degradation ≥2% in that particular test.
Other Updates
Updated PQP sample production factory witness data gathering
With persistent cost pressure on the upstream manufacturing, along with loopholes in the IEC standard favoring use of high measurement uncertainties, and strong competition for high efficiency, module manufacturers may be incentivized to adjust measurement systems in their favor. In response, we have decided to put more attention on surveying the most relevant information impacting power measurement uncertainty during our PQP sample production factory witnesses.
Reduced LID sample size
Previously achieved improvements in LID results have been maintained over the 2024-2025 PQP period, with the median LID power loss for 2025 Scorecard eligible BOMs being 0.4% for TOPCon, 0.4% for PERC, and 0.3% for HJT. As such, the LID sample size will be reduced from 17 samples down to 10.
Pre-test light soaking changes
Since launching the previous PQP edition, we have been actively collecting both outdoor LID, indoor light soaking and current induced degradation (CID) data for a vast subset of the PQP population, allowing us to evaluate correlation between the three conditioning methods.
We found relatively good correlation between CID and indoor light soaking methods. However, we observed poor correlation between indoor light soaking/CID and outdoor LID, largely caused by short-circuit current. Those Isc discrepancies are likely being caused by some non-recoverable soiling or glass/AR coating change not related to metastability or stabilization processes.
Based on this analysis, we have decided to maintain LID testing given its relevance to financial models, while allowing all three methods (outdoor LID, indoor light soak and CID) to be used for stabilizing modules before the other PQP test sequences.
Additional locations for energy yield simulations and IEC61853-3 energy ratings in PAN reports
Kiwa PVEL’s PAN reports will now employ the IEC 61853-3/4 energy rating methodology resulting in better module-level benchmarking by only comparing the impact of the modules performance parameters (IAM, low irradiance efficiency, bifaciality, temperature coefficient). This will also include six different reference climates, coupled with four common mounting configurations, offering better international representativeness than the original two US-based locations plus two mounting methods via the PVSyst simulations in our previous PAN reports. This broader representativeness will also ensure specific module designs are not favored as PAN Top Performers in the PV Module Reliability Scorecard.
Remove interim UVID characterizations with option to extend to UV360
UV testing chamber operations will be streamlined by skipping the interim characterization step, which may be impacted by the metastability issues mentioned above. Providing an option to extend testing addresses the need from the downstream (module buyers and independent engineers) to understand how the UVID degradation develops in the field over the years.
Kiwa PVEL's experiment on a UVID-sensitive BOM demonstrates that such saturation may take years to be reached (see below). The updated PQP addresses this need for extended data by offering manufacturers the opportunity to sign for an add-on UVID exposure up of 120+120kWh/m² (for a total dose of 360kWh/m²).
Strengthening Solar Confidence Through PQP Testing
As the solar industry continues to evolve at a rapid pace, Kiwa PVEL’s updated PQP ensures that buyers, developers, and stakeholders have the rigorous, data‑driven insights they need to make confident procurement decisions. By enhancing our approach to mechanical durability, refining stabilization processes for modern n‑type technologies, strengthening PQP sample production factory witnesses, and expanding the robustness of PAN and UVID testing, we’re delivering a clearer, more accurate picture of real‑world module performance than ever before. These updates reflect our ongoing commitment to advancing reliability standards and supporting a more resilient global solar fleet.